Introduction
Of all the visualisation configurations that Power BI has to offer, Small Multiples appear to be one of the lesser used options. This is a shame – in the right hands they can be extremely powerful and can allow for some very fast analysis. Let’s dig into how.
What are Small Multiples?
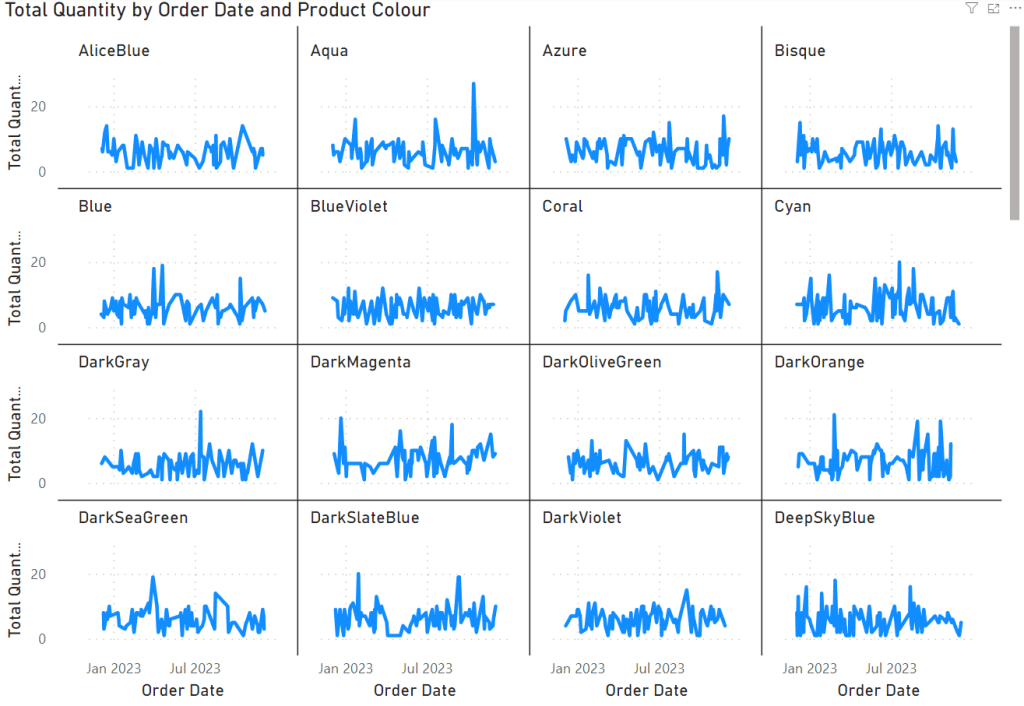
Small multiples refer to a visualisation technique that involves displaying multiple charts or graphs, each representing subsets of data based on distinct categories or groupings. These individual visualisations share common axes, scales, and dimensions, allowing for comparison and analysis across different segments of data. The beauty of small multiples lies in their capacity to simultaneously present multiple views of data, facilitating quick comparisons and highlighting variations across categories.
How to Create Small Multiples within Power BI
- Firstly, create a new dashboard in Power BI as you normally would, or open an existing dashboard.
- Create a new visualisation, ensuring that the visualisation type is one that supports Small Multiples. Examples can include Bar Chart, Line Chart or Scatter Plot
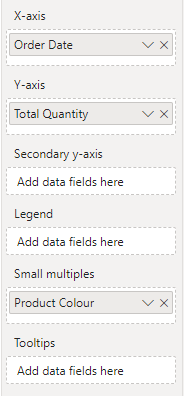
- In the Axes panel, drag the column that you wish to split the chart into multiple charts by – in my example, I am splitting by Product Colour
- And that’s it! Your chart should’ve split into multiple identical charts, sharing the same axes and allowing you to compare values across these attributes very quickly.
Leveraging Small Multiples for Insights
Small multiples serve as a powerful tool for data analysis and storytelling within Power BI. Here’s how they can be advantageous:
- Enhanced Comparison: Visualising data across multiple categories simultaneously allows for easier comparison and identification of trends or anomalies.
- Pattern Recognition: Detecting recurring patterns or trends becomes more apparent when viewing data side by side in small multiples.
- Segmented Analysis: Break down complex datasets into digestible segments, enabling a deeper understanding of each subset’s behavior and characteristics.
Summary
In summary, small multiples in Power BI serve as a valuable asset for data exploration and analysis. By leveraging this feature, users can gain a comprehensive understanding of their data, identify meaningful insights, and effectively communicate their findings. Embrace the power of small multiples in Power BI to unlock a world of insights hidden within your datasets.

Leave a reply to The Godfather of Visualisations and His Favourite Charts – Jammos Analytics Cancel reply